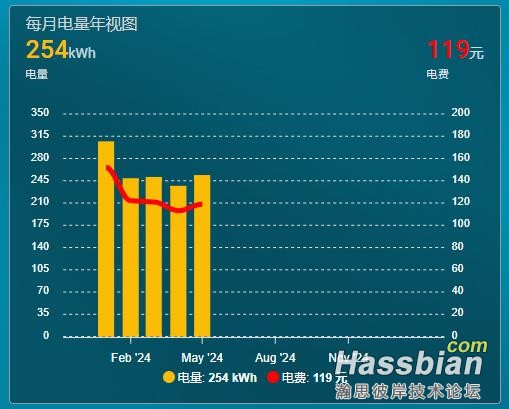
谢谢各位朋友捧场,我继续分享下每月电量、电费年视图展示成果

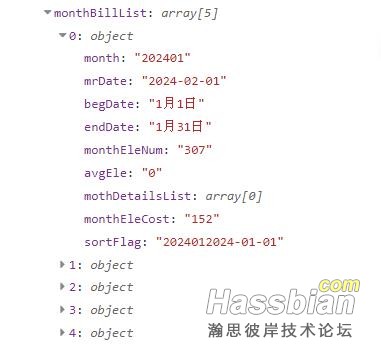
展示的数据依然来自state_grid.config文件,在powerUserList[x]下,monthBillList是月度账单,其中记录了每月的用电量、电费、所属月份,核算开始和结束日期等信息

把这些信息提取出来,添加到每月电量统计传感器中,就可以方便展示每月的电量、电费了

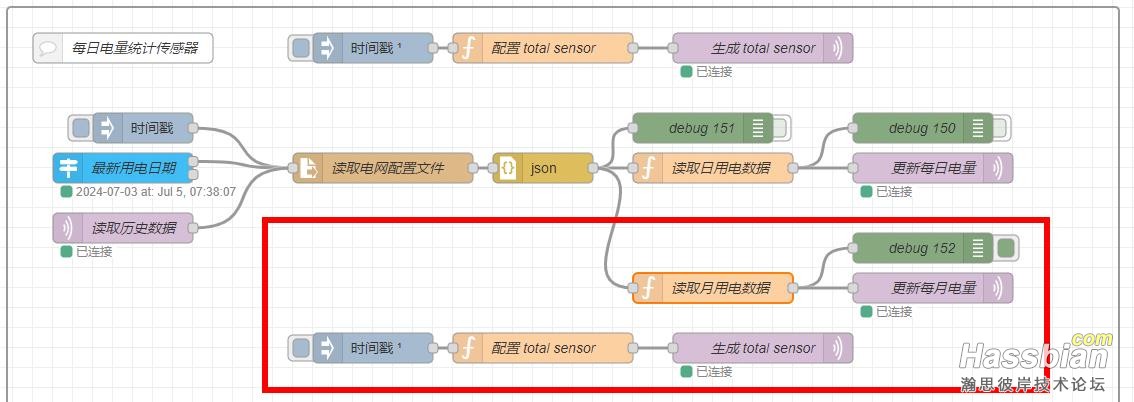
导出的流为红框标记的部分,大家导入后要和原有流程连接上
下面是图表卡片配置代码
type: custom:apexcharts-card
apex_config:
  chart:
    stacked: true
graph_span: 360d
span:
  end: year
show:
  loading: true
header:
  show: true
  show_states: true
  colorize_states: true
  title: 每月电量年视图
yaxis:
  - id: ll
    decimals: 0
    max: 350
  - id: rr
    opposite: true
    decimals: 0
    max: 200
series:
  - entity: sensor.mei_yue_dian_liang_tong_ji
    data_generator: |
      return entity.attributes.mon.map((m, index) => {
        return [new Date(m).getTime(), entity.attributes.kwh[index]];
      });
    name: 电量
    type: column
    color: '#fbbc05'
    yaxis_id: ll
  - entity: sensor.mei_yue_dian_liang_tong_ji
    data_generator: |
      return entity.attributes.mon.map((m, index) => {
        return [new Date(m).getTime(), entity.attributes.cost[index]];
      });
    name: 电费
    type: line
    extend_to: false
    unit: 元
    color: red
    yaxis_id: rr
|