本帖最后由 cjnt007 于 2025-7-14 08:41 编辑
最新图表代码更新在317楼分享,请移步阅读
seancheng 完善重启自动更新机制,前端卡片美化,在116楼分享,请移步阅读
最新研究成果【月度电量年视图】在46楼分享,请移步阅读
最新研究成果【历史电量数据读取新方案】在26楼分享,请移步阅读
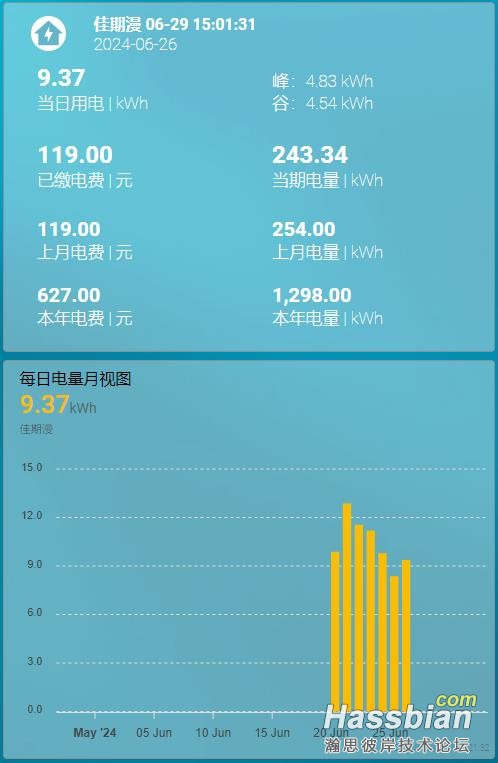
a.Dong大佬的【国家电网】为我们获取用电信息带来了极大的方便,但是这么多信息如何合理展示是个问题,坛子里有不少朋友分享了精彩方案,给了我很多启示,我也学着优化下了,先展示下阶段成果:
对比下没有校正过日期的图表:
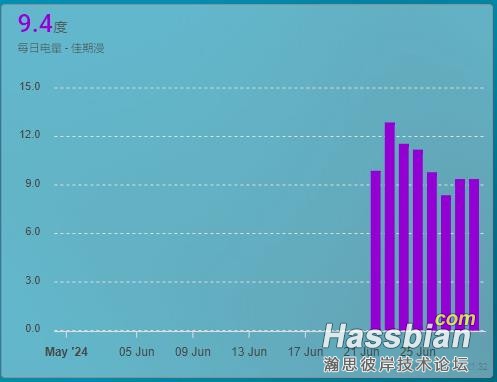
由于这个集成提供的用电信息不是实时的,总是延迟2-3天,用它们在图表中显示时,如果不加修正,所对应的日期就是错误的,经过不断尝试,总算把每日总用电量对应到正确的日期上了,功能上除了会在数据更新后,自动添加新的日用电信息外,还可以从历史数据中读取用电信息来更新图表。
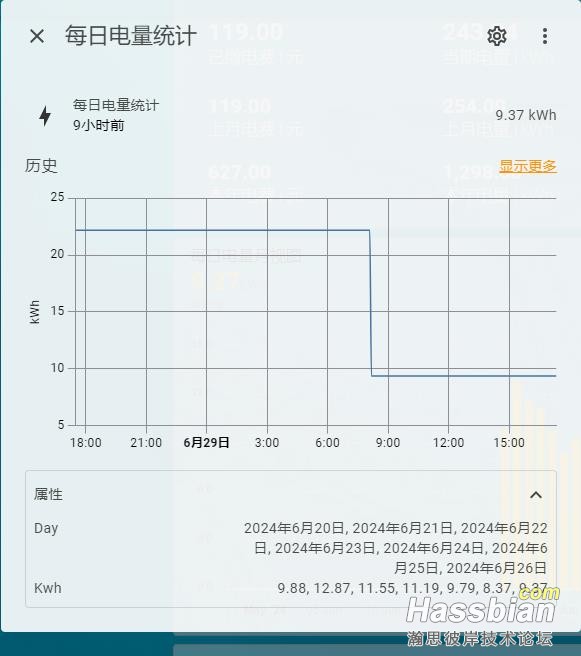
把日用电量和所属日期添加到实体属性里,供图表读取调用
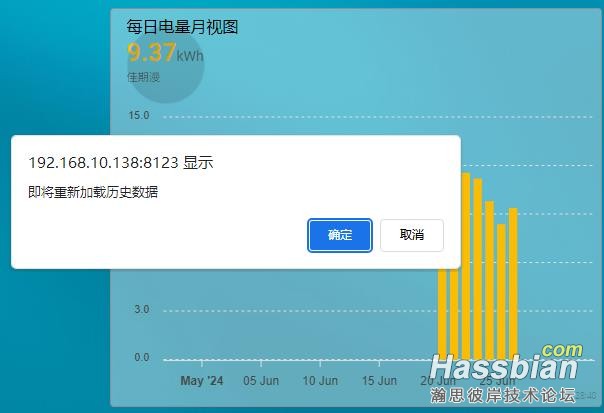
利用图表交互功能,手动/自动重载历史数据
目前还在测试中,等方案完善了,再来分享源码……,敬请期待
优化下了数据展示卡片,把数据所属日期放到标题后面,数据刷新时间放到第二行,如果token失效,刷新时间会显示为“刷新 Token 失败,需要重新登录!”方便及时操作。
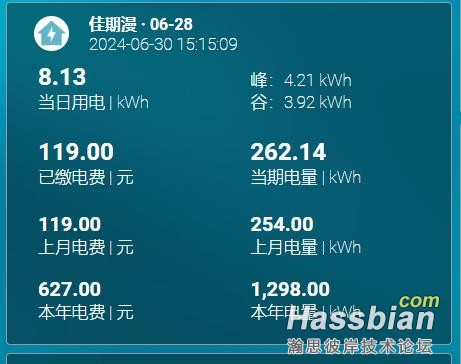
要实现此效果,需要先安装button-card卡片,下面是卡片配置代码,把其中“3208109130xxx”和“地名”替换为自己的就行,熟悉button card配置的朋友可自行修改优化,建议使用button card的模板功能简化下。
type: custom:button-card
entity: sensor.state_grid_3208109130xxx_refresh_time
name: >
  [[[ return `地名 ·
  ${states['sensor.state_grid_3208109130xxx_daily_lasted_date'].state.substr(5)}`]]]
icon: mdi:home-lightning-bolt
show_icon: true
show_state: true
show_name: true
styles:
  img_cell:
    - justify-self: start
    - width: 70px
  icon:
    - width: 35px
    - height: 35px
    - color: rgb(99,181,200)
    - background-color: white
    - border-radius: 50%
  name:
    - font-weight: bold
    - font-size: 16px
    - justify-self: start
    - margin-left: '-66%'
  state:
    - justify-self: start
    - font-weight: 1
    - margin-left: '-66%'
  card:
    - padding: 10px
    - color: white
  grid:
    - grid-template-areas: '"i n" "i s" "i l" "a0 a1" "a b""c d""e f"'
    - grid-template-columns: 1fr 1fr
    - grid-template-rows: 1fr min-content min-content min-content
custom_fields:
  a0:
    card:
      type: custom:button-card
      entity: sensor.state_grid_3208109130xxx_daily_ele_num
      name: 当日用电 | kWh
      show_icon: false
      show_name: true
      show_state: true
      show_units: false
      styles:
        grid:
          - grid-template-areas: '"s" "n"'
        card:
          - background: none
          - border: none
          - box-shadow: none
          - color: white
        name:
          - align-self: start
          - justify-self: start
          - margin-left: 10%
          - font-weight: 1
        state:
          - align-self: start
          - justify-self: start
          - margin-left: 10%
          - font-weight: bold
          - font-size: 24px
          - color: white
      state:
        - value: 0
          operator: <
          styles:
            state:
              - color: var(--mdc-theme-primary)
  a1:
    card:
      type: custom:button-card
      label: >
        [[[return
        `峰:${states['sensor.state_grid_3208109130xxx_daily_p_ele_num'].state}
        kWh`]]]
      name: >
        [[[return
        `谷:${states['sensor.state_grid_3208109130xxx_daily_v_ele_num'].state}
        kWh`]]]
      show_icon: false
      show_name: true
      show_label: true
      show_units: false
      styles:
        grid:
          - grid-template-areas: '"l" "n"'
        card:
          - background: none
          - border: none
          - box-shadow: none
          - color: white
        name:
          - align-self: start
          - justify-self: start
          - margin-left: 10%
          - font-weight: 1
          - color: white
        label:
          - align-self: start
          - justify-self: start
          - margin-left: 10%
          - font-weight: 1
          - color: white
  a:
    card:
      type: custom:button-card
      entity: sensor.state_grid_3208109130xxx_balance
      name: 已缴电费 | 元
      show_icon: false
      show_name: true
      show_state: true
      show_units: false
      styles:
        grid:
          - grid-template-areas: '"s" "n"'
        card:
          - background: none
          - border: none
          - box-shadow: none
          - color: white
        name:
          - align-self: start
          - justify-self: start
          - margin-left: 10%
          - font-weight: 1
        state:
          - align-self: start
          - justify-self: start
          - margin-left: 10%
          - font-weight: bold
          - font-size: 24px
          - color: white
      state:
        - value: 0
          operator: <
          styles:
            state:
              - color: var(--mdc-theme-primary)
  b:
    card:
      type: custom:button-card
      entity: sensor.state_grid_3208109130xxx_month_ele_num
      name: 当期电量 | kWh
      show_icon: false
      show_name: true
      show_state: true
      show_units: false
      styles:
        grid:
          - grid-template-areas: '"s" "n"'
        card:
          - background: none
          - border: none
          - box-shadow: none
          - color: white
        name:
          - align-self: start
          - justify-self: start
          - margin-left: 10%
          - font-weight: 1
        state:
          - align-self: start
          - justify-self: start
          - margin-left: 10%
          - font-weight: bold
          - font-size: 24px
  c:
    card:
      type: custom:button-card
      entity: sensor.state_grid_3208109130xxx_last_month_ele_cost
      name: 上月电费 | 元
      show_icon: false
      show_name: true
      show_state: true
      show_units: false
      styles:
        grid:
          - grid-template-areas: '"s" "n"'
        card:
          - background: none
          - border: none
          - box-shadow: none
          - color: white
        name:
          - align-self: start
          - justify-self: start
          - margin-left: 10%
          - font-weight: 1
        state:
          - align-self: start
          - justify-self: start
          - margin-left: 10%
          - font-weight: bold
          - font-size: 20px
  d:
    card:
      type: custom:button-card
      entity: sensor.state_grid_3208109130xxx_last_month_ele_num
      name: 上月电量 | kWh
      show_icon: false
      show_name: true
      show_state: true
      show_units: false
      styles:
        grid:
          - grid-template-areas: '"s" "n"'
        card:
          - background: none
          - border: none
          - box-shadow: none
          - color: white
        name:
          - align-self: start
          - justify-self: start
          - margin-left: 10%
          - font-weight: 1
        state:
          - align-self: start
          - justify-self: start
          - margin-left: 10%
          - font-weight: bold
          - font-size: 20px
  e:
    card:
      type: custom:button-card
      entity: sensor.state_grid_3208109130xxx_year_ele_cost
      name: 本年电费 | 元
      show_icon: false
      show_name: true
      show_state: true
      show_units: false
      styles:
        grid:
          - grid-template-areas: '"s" "n"'
        card:
          - background: none
          - border: none
          - box-shadow: none
          - color: white
        name:
          - align-self: start
          - justify-self: start
          - margin-left: 10%
          - font-weight: 1
        state:
          - align-self: start
          - justify-self: start
          - margin-left: 10%
          - font-weight: bold
          - font-size: 20px
  f:
    card:
      type: custom:button-card
      entity: sensor.state_grid_3208109130xxx_year_ele_num
      name: 本年电量 | kWh
      show_icon: false
      show_name: true
      show_state: true
      show_units: false
      styles:
        grid:
          - grid-template-areas: '"s" "n"'
        card:
          - background: none
          - border: none
          - box-shadow: none
          - color: white
        name:
          - align-self: start
          - justify-self: start
          - margin-left: 10%
          - font-weight: 1
        state:
          - align-self: start
          - justify-self: start
          - margin-left: 10%
          - font-weight: bold
          - font-size: 20px
数据校正和图表展示功能,需要Node-RED、MQTT加载项和apexcharts-card卡片,请提前配置好。NR中要安装Home Assistant节点,以下是流程图和代码:
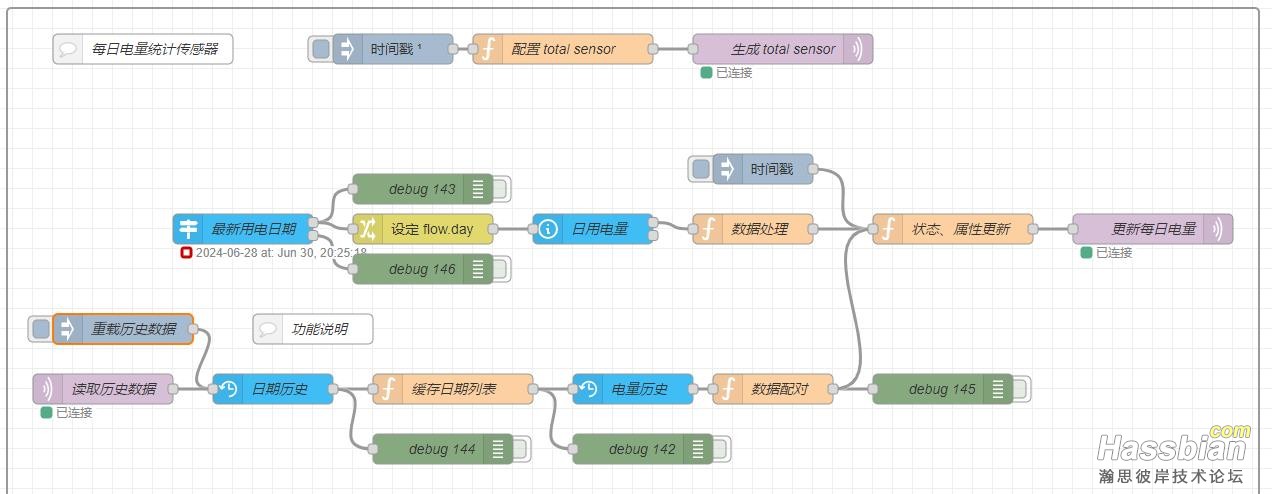
导入流程后,注意重新设置下几个蓝色HA节点和MQTT in/out的服务器配置。第一行的流程用于生成一个每日电量统计传感器,NR部署后,应该能自动生成,如果HA里没有,手动点击下“时间戳”节点。中间一行是根据用电所属日期更新触发,添加最新用电数据。第三行用于重载最近30天的历史数据,可以在apexcharts-card卡片的表头点击,手动加载。代码的相关说明在备注及注释里有,喜欢研究的朋友自行查看。
前端图表展示用到apexcharts-card卡片,配置代码如下:
type: custom:apexcharts-card
apex_config:
  chart:
    stacked: true
graph_span: 30d
span:
  end: day
show:
  last_updated: true
header:
  show: true
  show_states: true
  colorize_states: true
  title: 每日电量月视图
series:
  - entity: sensor.dian_liang_tong_ji_energy
    data_generator: |
      return entity.attributes.day.map((d, index) => {
        return [new Date(d).getTime(), entity.attributes.kwh[index]];
      });
    name: 佳期漫
    type: column
    color: '#fbbc05'
    float_precision: 2
    header_actions:
      tap_action:
        action: call-service
        service: mqtt.publish
        service_data:
          topic: stategrid/historydata/update
          qos: 0
          retain: false
        confirmation:
          text: 即将重新加载历史数据
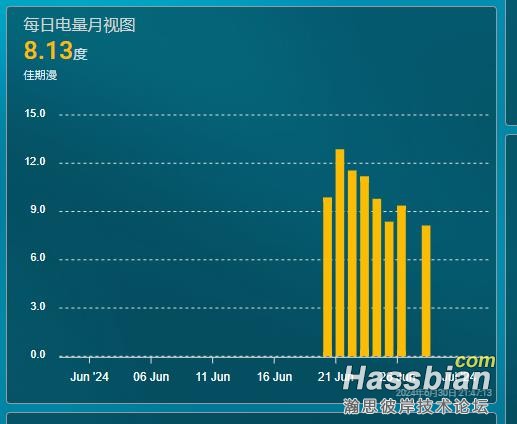
上图中,由于token失效没有及时重新登录,少了6月27日一天的历史电量,28日的电量是重新登录后获取到的,自动加在对应日期上了,代码好像没有大问题。
各位在使用中发现什么问题,欢迎跟帖探讨!
|