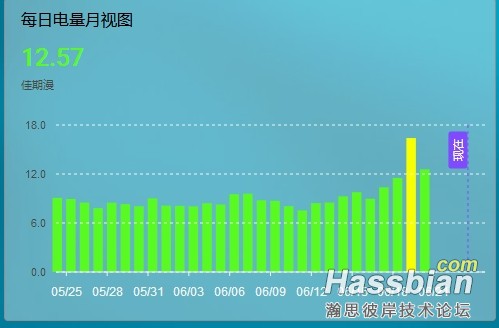
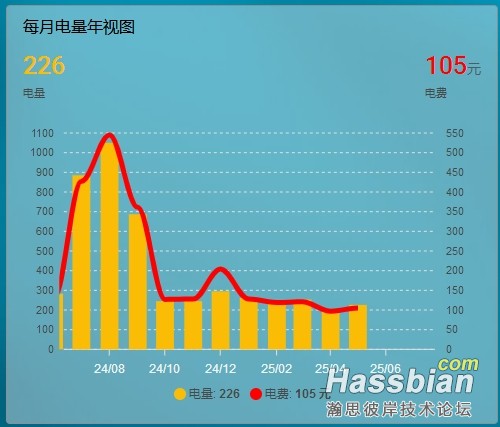
大佬在后续版本的更新中,添加了sensor.state_grid_xxxx_recent_30_daily_ele_list 和 sensor.state_grid_xxxx_recent_12_monthly_ele_list 两个实体,分别提供最近30天日用电量和最近12个月电量、电费数据,这样的话,就可以直接通过这两个实体获取到历史用电数据,而不用通过NR流程来整理数据了。
相应的图表代码分享如下:

type: custom:apexcharts-card
series:
  - entity: sensor.state_grid_你的用户号_recent_30_daily_ele_list
    name: 家庭名称
    color: "#f9d505"
    opacity: 1
    stroke_width: 0
    type: column
    curve: smooth
    extend_to: end
    float_precision: 2
    fill_raw: last
    data_generator: |
      return entity.attributes.graph.map((d) => {
        return [new Date(d.day.substr(0,4)+'-'+d.day.substr(4,2)+'-'+d.day.substr(6,2)).getTime(), d.ele];
      });
    show:
      datalabels: false
      extremas: false
      name_in_header: true
      header_color_threshold: true
    color_threshold:
      - value: 0
        color: "#58FA21"
        opacity: 1
      - value: 15
        color: "#F7FF00"
        opacity: 1
      - value: 30
        color: "#FF9500"
        opacity: 1
graph_span: 30d
span:
  end: day
show:
  last_updated: false
now:
  show: true
  color: "#804aff"
  label: 现在
header:
  show: true
  show_states: true
  colorize_states: true
  title: 每日电量月视图
  standard_format: false
apex_config:
  grid:
    position: front
    borderColor: "#F0F5F2"
    strokeDashArray: 3
    row:
      colors:
        - black
        - transparent
      opacity: 0
    xaxis:
      lines:
        show: false
    yaxis:
      lines:
        show: true
  chart:
    stacked: false
    height: 210
  xaxis:
    tickPlacement: "off"
    labels:
      show: true
      style:
        colors: "#F0F5F2"
        fontSize: 12px
      format: MM/dd
    axisBorder:
      show: true
      color: "#F0F5F2"
      height: 1
    axisTicks:
      show: true
      borderType: solid
      color: "#F0F5F2"
      height: 4
    crosshairs:
      show: true
      width: 1
      position: front
      opacity: 1
      stroke:
        color: "#464A47"
        width: 1
        dashArray: 2
    tooltip:
      enabled: false
  yaxis:
    show: true
    showAlways: false
    logarithmic: false
experimental:
  color_threshold: true

type: custom:apexcharts-card
apex_config:
  chart:
    stacked: true
  xaxis:
    tickPlacement: "on"
    labels:
      show: true
      style:
        colors: "#F0F5F2"
        fontSize: 12px
      format: yy/MM
    tooltip:
      enabled: false
graph_span: 360d
span:
  end: month
show:
  loading: true
header:
  show: true
  show_states: true
  colorize_states: true
  title: 每月电量年视图
yaxis:
  - id: ll
    decimals: 0
    max: 1100
    min: 0
  - id: rr
    opposite: true
    decimals: 0
    max: 550
    min: 0
series:
  - entity: sensor.state_grid_你的用户号_recent_12_monthly_ele_list
    data_generator: |
      return entity.attributes.graph.map((m) => {
        return [new Date(m.month.substr(0,4)+'-'+m.month.substr(4,2)+'-01').getTime(), m.ele];
      });
    name: 电量
    type: column
    color: "#fbbc05"
    yaxis_id: ll
  - entity: sensor.state_grid_你的用户号_recent_12_monthly_ele_list
    data_generator: |
      return entity.attributes.graph.map((m) => {
        return [new Date(m.month.substr(0,4)+'-'+m.month.substr(4,2)+'-01').getTime(), m.cost];
      });
    name: 电费
    type: line
    extend_to: false
    unit: 元
    color: red
    yaxis_id: rr
|