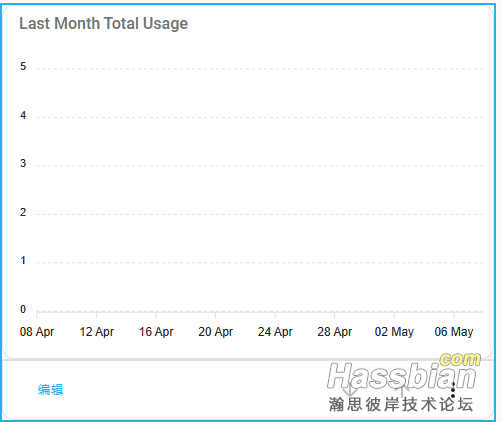
本帖最后由 hunl1986 于 2023-5-7 23:54 编辑
请问使用custom:apexcharts-card图表显示电量使用情况,0317100228518312-this_month_total_usage实体状态属性为格式为 YAML,内容为
state_class: total
this_month_by_day:
  - date: '2023-05-01'
    kwh: 3
  - date: '2023-05-02'
    kwh: 6.47
  - date: '2023-05-03'
    kwh: 15.9
  - date: '2023-05-04'
    kwh: 3.72
  - date: '2023-05-05'
    kwh: 3.22
  - date: '2023-05-06'
    kwh: 3.84
unit_of_measurement: kWh
device_class: energy
icon: mdi:lightning-bolt
friendly_name: 0317100228518312-this_month_total_usage
图表中代码为
type: 'custom:apexcharts-card'
graph_span: 24d
header:
  show: true
  title: Last Month Total Usage
series:
  - entity: sensor.0317100228518312_this_month_total_usage
    data_generator: |
      const data = []
      const values = entity.state['this_month_by_day']
      for (const i in values) {
        const date = new Date(values[i]['date']);
        const kwh = values[i]['kwh'];
        data.push([date, kwh]);
      }
      return [{
        name: 'Usage',
        data: data,
      }];
    type: column
请问有什么错误,图表中没有数据显示,空白一片,麻烦大家帮忙看看代码那里错了

|