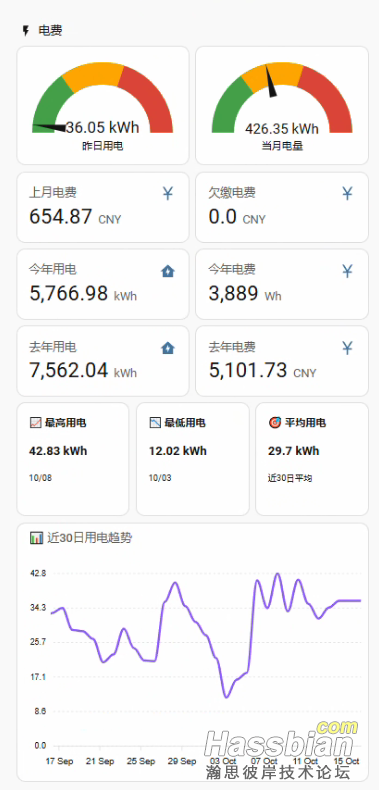
用了cubicpil大大的南方电网电费数据HA集成(https://bbs.hassbian.com/thread-18578-1-1.html)和hunl1986大大的[UI界面] 记录南方电网集成UI界面使用(sensor和apexcharts-card卡片)(https://bbs.hassbian.com/forum.php?mod=viewthread&tid=21834&page=1&authorid=62030)

具体代码:
type: grid
columns: 2
square: false
cards:
  - type: vertical-stack
    cards:
      - type: gauge
        entity: sensor.lastdate_power_2
        name: 昨日用电
        unit: kWh
        min: 0
        max: 1000
        severity:
          green: 0
          yellow: 300
          red: 600
        needle: true
  - type: vertical-stack
    cards:
      - type: gauge
        entity: sensor.curmonth_power_2
        name: 当月电量
        unit: kWh
        min: 0
        max: 1000
        severity:
          green: 0
          yellow: 300
          red: 600
        needle: true
type: vertical-stack
cards:
  - type: horizontal-stack
    cards:
      - hours_to_show: 24
        graph: none
        type: sensor
        detail: 1
        entity: sensor.lastmonth_fee_2
        name: 上月电费
      - hours_to_show: 24
        graph: none
        type: sensor
        detail: 1
        entity: sensor.0800150051235490_arrears
        name: 欠缴电费
  - type: horizontal-stack
    cards:
      - hours_to_show: 24
        graph: none
        type: sensor
        detail: 1
        entity: sensor.year_power_2
        name: 今年用电
      - hours_to_show: 24
        graph: none
        type: sensor
        detail: 1
        entity: sensor.year_fee_2
        name: 今年电费
  - type: horizontal-stack
    cards:
      - hours_to_show: 24
        graph: none
        type: sensor
        detail: 1
        entity: sensor.lastyear_power_2
        name: 去年用电
      - hours_to_show: 24
        graph: none
        type: sensor
        detail: 1
        entity: sensor.lastyear_fee_2
        name: 去年电费
type: vertical-stack
cards:
  - type: grid
    columns: 3
    cards:
      - type: markdown
        content: >
          **📈 最高用电**

          <h3 style="color: #EF4444; margin: 5px 0;">{{
          (state_attr('sensor.history_day', 'history_day_value')[-30:] |
          map(attribute='kwh') | max) }} kWh</h3>

          <small style="color: #666;">

          {% set max_kwh = state_attr('sensor.history_day',
          'history_day_value')[-30:] | map(attribute='kwh') | max %}

          {% set max_date = state_attr('sensor.history_day',
          'history_day_value')[-30:] | selectattr('kwh', 'equalto', max_kwh) |
          map(attribute='date') | first %}

          {{ max_date[5:7] }}/{{ max_date[8:10] }}

          </small>
      - type: markdown
        content: >
          **📉 最低用电**

          <h3 style="color: #3B82F6; margin: 5px 0;">{{
          (state_attr('sensor.history_day', 'history_day_value')[-30:] |
          map(attribute='kwh') | min) }} kWh</h3>

          <small style="color: #666;">

          {% set min_kwh = state_attr('sensor.history_day',
          'history_day_value')[-30:] | map(attribute='kwh') | min %}

          {% set min_date = state_attr('sensor.history_day',
          'history_day_value')[-30:] | selectattr('kwh', 'equalto', min_kwh) |
          map(attribute='date') | first %}

          {{ min_date[5:7] }}/{{ min_date[8:10] }}

          </small>
      - type: markdown
        content: >
          **🎯 平均用电**

          <h3 style="color: #10B981; margin: 5px 0;">{{
          ((state_attr('sensor.history_day', 'history_day_value')[-30:] |
          map(attribute='kwh') | sum) / (state_attr('sensor.history_day',
          'history_day_value')[-30:] | length)) | round(1) }} kWh</h3>

          <small style="color: #666;">近30日平均</small>
  - type: custom:apexcharts-card
    header:
      show: true
      title: 📊 近30日用电趋势
    graph_span: 30d
    series:
      - entity: sensor.history_day
        type: line
        name: 日用电量
        color: "#8B5CF6"
        stroke_width: 3
        unit: kWh
        curve: smooth
        data_generator: |
          const dailyData = entity.attributes.history_day_value || [];
          const recentData = dailyData.slice(-30);
          return recentData.map(item => {
            const date = new Date(item.date);
            return [date.getTime(), parseFloat(item.kwh) || 0];
          });
    yaxis:
      - min: 0
        decimals: 1
|